Query your warehouse, uploaded files, or dataframes directly with SQL.
Izzy Miller
Build narrative data stories that combine charts, text, and live data in one Hex document. Covers effective data storytelling with interactive examples.
Compare MoM, QoQ, and YoY metrics in SQL with reusable logic. This Hex template covers period-over-period analysis with working query examples.
Calculate and visualize customer lifetime value in Hex using SQL and Python. This template covers LTV modeling, segmentation, and dashboard building.
Track stock levels, forecast demand, and find reorder points with SQL and Python in Hex. This inventory management template covers the key analysis techniques.
Track churn rate, identify at-risk segments, and forecast retention. This Hex template builds an interactive customer churn dashboard with SQL and Python.
Build a company metrics dashboard in Hex with SQL and Python. Track KPIs, visualize trends, and share insights across your org.
Detect anomalies using IQR, Z-score, Isolation Forest, and more in a Hex notebook. Covers the main outlier detection methods with working Python code.
Build a churn prediction model in Hex using Python and scikit-learn. Covers feature engineering, training, and model evaluation with working examples.
Write SQL alongside Python, charts, and narrative in a Hex notebook. See why SQL notebooks beat standalone query editors for complex analysis. Try it free.
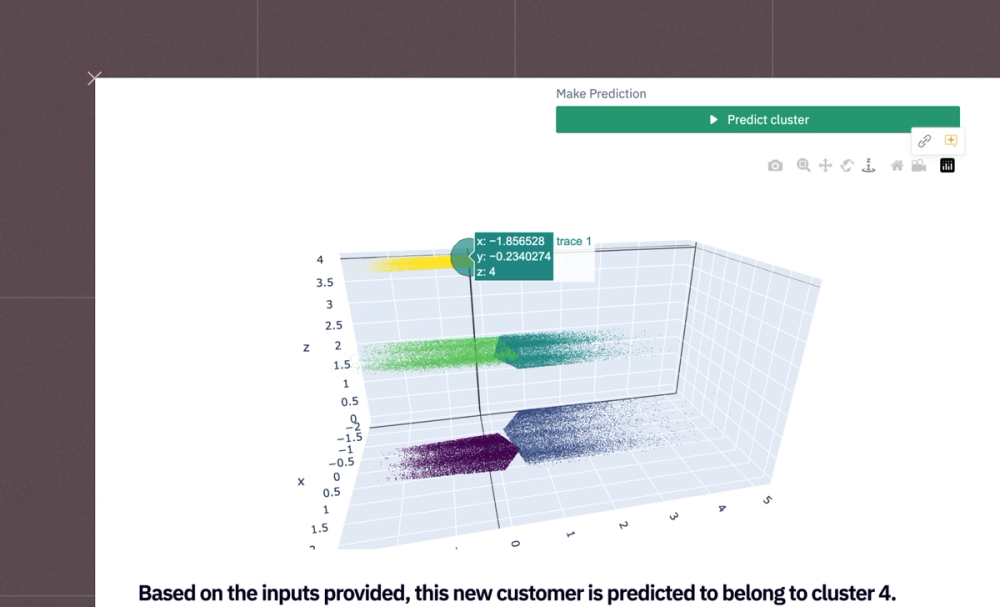
Group users by behavior or purchase history using clustering in Python. This Hex customer segmentation template covers K-means, charts, and interpretation.
Parse tweets, posts, and comments to track brand sentiment over time. Hex template covers sentiment scoring, aggregation, and trend charts in Python.
Discover how Hex data scientists and analysts use Hex for everything from dashboards to deep dives.
Pivot cells allow you to interactively aggregate and pivot your data, in a UI-first way.
Table display cells are a way to visualize, filter, and format tabular data without writing any code. Simply choose a dataframe and use the Table display settings to apply any fitlers, change the data format of any column, hide any column, wrap text.
Hex’s first-class Python support unlocks a world of opportunity for data exploration.
Text and Markdown cells let you add narrative, explanations, and context to your data project.
Input parameters are a core, unique part of Hex. Input parameters can be created in the Notebook view and then added, optionally, to an app.
Map cells let you visualize geographic data in a customizable interactive map.